ADC
We have seen in the previous documents (available here) how to read and monitor a varying power source from the Raspberry PI using a chip MCP3008.
The power source was in those cases provided by the Raspberry PI itself. Those voltages range from 1.2 Volt (at the CPU level), to 5 Volts (power supply, pin #2 on the GPIO Header), the GPIO pins deliver a 3.3 Volts output.
The MCP3008 itself would not take any current greater than 5 Volts.
If we want to monitor a 12 Volt system (on a boat, an RV, a solar panel...), we will need to use some voltage divider, in order not to overload - and fry - the components we will use.
This divider will sit between the power source to monitor, and the pins CH0 to CH7 of the MCP3008.
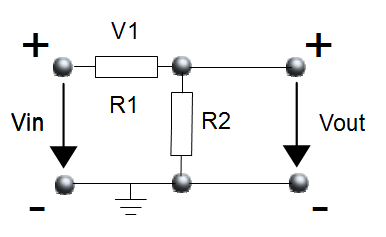
The divider
Vin is the 12 Volt system to monitor. It can go up to 15 Volts.Vout is what will be used from the MCP3008 standpoint. The + terminal will go to its CH[0-7] pins.V1 is the tension across the resistor R1.
Vout (which can also be named V2) is the tension across the resistor R2.
We (should) know that
| V1 = Vin × | R1 | and | V2 = Vin × | R2 |
| R1 + R2 | R1 + R2 |
| Vin | V |
| R1 | kΩ |
| R2 | kΩ |
| Vout | 3.72 V |
Here is the full setup. Notice the following elements:


All set with the hardware.
The MCP3008 returns values ranging from 0 to 1023 (210 = 1024).
We need to calibrate the hardware so we can directly read the voltage from the program running on the Raspberry PI.
To do so, with the setup above, on the Raspberry PI, start the following script:
Prompt> ./battery.monitor -calibration
Turn the potentiometer all the way counter-clockwise
  Prompt> ./battery.monitor -calibration
  Read an ADC
	Parameters are:
	  -calibration or -cal
	  -debug=y|n|yes|no|true|false - example -debug=y        (default is n)
	  -ch=[0-7]                    - example -ch=0           (default is 0)
	  -min=minADC:minVolt          - example -min=280:3.75   (default is    0:0.0)
	  -max=maxADC:maxVolt          - example -min=879:11.25  (default is 1023:15.0)
	  -tune=ADC:volt               - example -tune=973:12.6  (default is 1023:15.0)
	  -scale=y|n                   - example -scale=y        (default is n)
	  -log=[log-file-name]         - example -log=[batt.csv] (default is battery.log)
  Prms: ADC Channel:0 MinADC:0, MinVolt:0.0, MaxADC:1023, maxVolt:15.0
  readAdc:286 (0x11E, 0&100011110) Volume:27% (286) Volt:4.193548
  readAdc:293 (0x125, 0&100100101) Volume:28% (293) Volt:4.296188
  readAdc:283 (0x11B, 0&100011011) Volume:27% (283) Volt:4.14956
  readAdc:289 (0x121, 0&100100001) Volume:28% (289) Volt:4.2375364
Read the voltmeter: In this example, let's say that it displays 3.75 Volts, when the ADC value is at 289.
  ...
  readAdc:606 (0x25E, 0&1001011110) Volume:59% (606) Volt:8.885631
  readAdc:654 (0x28E, 0&1010001110) Volume:63% (654) Volt:9.589443
  readAdc:717 (0x2CD, 0&1011001101) Volume:70% (717) Volt:10.513197
  readAdc:808 (0x328, 0&1100101000) Volume:78% (808) Volt:11.847507
  readAdc:872 (0x368, 0&1101101000) Volume:85% (872) Volt:12.785924
In this example, the voltmeter reads 11.75 Volts when the ADC says 872.
| ADC | Voltmeter | |
| Mini | 289 | 3.75 |
| Maxi | 872 | 11.75 |
-min and -max parameters, and how they relate to the table above. Move the potentiometer back and forth.
  Prompt> ./battery.monitor -min=289:3.75 -max=872:11.75 -debug=y
  Read an ADC
	Parameters are:
	  -calibration or -cal
	  -debug=y|n|yes|no|true|false - example -debug=y        (default is n)
	  -ch=[0-7]                    - example -ch=0           (default is 0)
	  -min=minADC:minVolt          - example -min=280:3.75   (default is    0:0.0)
	  -max=maxADC:maxVolt          - example -min=879:11.25  (default is 1023:15.0)
	  -tune=ADC:volt               - example -tune=973:12.6  (default is 1023:15.0)
	  -scale=y|n                   - example -scale=y        (default is n)
	  -log=[log-file-name]         - example -log=[batt.csv] (default is battery.log)
  Prms: ADC Channel:0 MinADC:289, MinVolt:3.75, MaxADC:872, maxVolt:11.75
  readAdc:759 (0x2F7, 0&1011110111) Volume:74% (759) Volt:10.1994
  readAdc:746 (0x2EA, 0&1011101010) Volume:72% (746) Volt:10.021011
  readAdc:711 (0x2C7, 0&1011000111) Volume:69% (711) Volt:9.540737
  readAdc:667 (0x29B, 0&1010011011) Volume:65% (667) Volt:8.936964
  readAdc:642 (0x282, 0&1010000010) Volume:62% (642) Volt:8.59391
  readAdc:617 (0x269, 0&1001101001) Volume:60% (617) Volt:8.250858
  readAdc:601 (0x259, 0&1001011001) Volume:58% (601) Volt:8.031303
  readAdc:593 (0x251, 0&1001010001) Volume:57% (593) Volt:7.9215264
  readAdc:609 (0x261, 0&1001100001) Volume:59% (609) Volt:8.141081
  readAdc:625 (0x271, 0&1001110001) Volume:61% (625) Volt:8.360635
  readAdc:647 (0x287, 0&1010000111) Volume:63% (647) Volt:8.662521
  readAdc:681 (0x2A9, 0&1010101001) Volume:66% (681) Volt:9.129074
  readAdc:716 (0x2CC, 0&1011001100) Volume:69% (716) Volt:9.609348
  readAdc:754 (0x2F2, 0&1011110010) Volume:73% (754) Volt:10.130789
  readAdc:794 (0x31A, 0&1100011010) Volume:77% (794) Volt:10.679674
  readAdc:842 (0x34A, 0&1101001010) Volume:82% (842) Volt:11.338336
  readAdc:862 (0x35E, 0&1101011110) Volume:84% (862) Volt:11.612779
  readAdc:808 (0x328, 0&1100101000) Volume:78% (808) Volt:10.871784
  readAdc:756 (0x2F4, 0&1011110100) Volume:73% (756) Volt:10.158234
  readAdc:716 (0x2CC, 0&1011001100) Volume:69% (716) Volt:9.609348
  readAdc:680 (0x2A8, 0&1010101000) Volume:66% (680) Volt:9.115352
  readAdc:648 (0x288, 0&1010001000) Volume:63% (648) Volt:8.676244
  readAdc:629 (0x275, 0&1001110101) Volume:61% (629) Volt:8.415524
  readAdc:615 (0x267, 0&1001100111) Volume:60% (615) Volt:8.223413
  readAdc:602 (0x25A, 0&1001011010) Volume:58% (602) Volt:8.045026
  readAdc:586 (0x24A, 0&1001001010) Volume:57% (586) Volt:7.825472
  readAdc:580 (0x244, 0&1001000100) Volume:56% (580) Volt:7.7431393
  readAdc:587 (0x24B, 0&1001001011) Volume:57% (587) Volt:7.839194
  readAdc:605 (0x25D, 0&1001011101) Volume:59% (605) Volt:8.086192
  readAdc:630 (0x276, 0&1001110110) Volume:61% (630) Volt:8.429245
  readAdc:669 (0x29D, 0&1010011101) Volume:65% (669) Volt:8.964409
The voltage displayed on the screen should match what's read on the voltmeter.
You can use 2 points as above, or one only.
In the case you use only one, we will assume that for 0 ADC, we have 0 Volts.
Let us see.
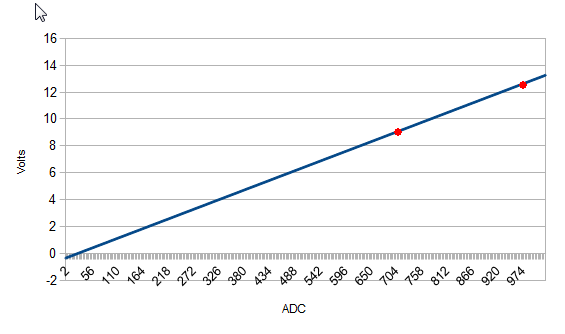
If we use the following calibration parameters:
-min=695:9.1 -max=973:12.6 -scale=yThe voltage ranges from
-0.3500028 V for ADC=0, to 13.265468 V for ADC=1023.
This produces the following figure.
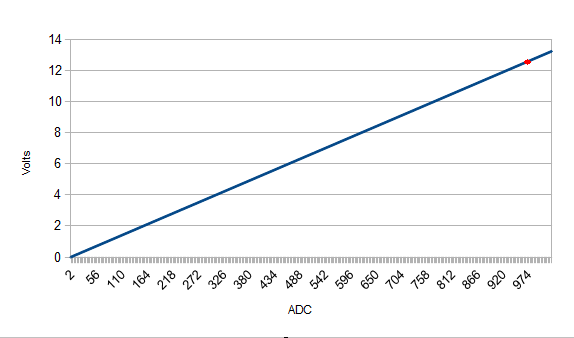
-tune=973:12.6 -scale=y
The voltage ranges from 0.0 V to 13.247482 V for ADC=1023, and produces the following figure.
Run the script without the -debug parameter.
  Prompt>./battery.monitor -tune=973:12.6
  Read an ADC
	Parameters are:
	  -calibration or -cal
	  -debug=y|n|yes|no|true|false - example -debug=y        (default is n)
	  -ch=[0-7]                    - example -ch=0           (default is 0)
	  -min=minADC:minVolt          - example -min=280:3.75   (default is    0:0.0)
	  -max=maxADC:maxVolt          - example -min=879:11.25  (default is 1023:15.0)
	  -tune=ADC:volt               - example -tune=973:12.6  (default is 1023:15.0)
	  -scale=y|n                   - example -scale=y        (default is n)
	  -log=[log-file-name]         - example -log=[batt.csv] (default is battery.log)
  Prms: ADC Channel:0, tuningADC:973, tuningVolt:12.6

    ....

  ^C
  Shutting down
  Closing log file
  Shutting down...
  Prompt>
Let it run as long as you want, and stop it with a SIGTERM (Ctrl+C).
battery.log, as CSV data. Columns are date, ADC, Volts.
  Prompt> tail battery.log
  2014-04-19 11:45:39.804;523;6.9609776
  2014-04-19 11:45:39.907;558;7.441252
  2014-04-19 11:45:40.009;589;7.866638
  2014-04-19 11:45:40.112;636;8.511578
  2014-04-19 11:45:40.229;681;9.129074
  2014-04-19 11:45:40.331;736;9.883791
  2014-04-19 11:45:40.439;788;10.597342
  2014-04-19 11:45:40.542;850;11.448113
  2014-04-19 11:45:40.645;875;11.791166
  2014-04-19 11:45:41.455;869;11.708834
  Prompt>
Once the prototyping phase is validated, all the components are set on a Slice of PI.

The components on the board

Wired. At work.
The logging is performed as above.

At work.
After a couple of tests, there was some room for improvement, on the software side mostly.
On the hardware side though, a smaller potentiometer considerably reduced the height of the device, and it fits in the chart table.
Also, it could be a good idea to leave some possibility to use some I2C board. As the Slice of PI uses the full GPIO header, four wires have been soldered (GND, 3V3, SCL, SDA), they could be plugged onto a breadboard to use breakout boards like a BMP180, for example.

In the chart table. Smaller potentiometer, an I2C extension. NMEA Logging.
	$IIMTW,+14.5,C*38
	$IIMWV,151,R,04.4,N,A*16
	$IIMWV,150,T,04.5,N,A*10
	$IIRMC,030143,A,3730.078,N,12228.856,W,00.0,148,230514,15,E,A*1B
	$IIVHW,,,359,M,00.0,N,,*6B
	$XXBAT,14.16,V,966,94*19
	$IIVLW,08189,N,000.0,N*5B
	$IIVWR,151,R,04.4,N,,,,*64
	$IIGLL,3730.078,N,12228.856,W,030143,A,A*4F
	$IIHDG,359,,,15,E*19
	$IIMTW,+14.5,C*38
	$IIMWV,152,R,05.1,N,A*11
	$IIMWV,151,T,04.4,N,A*10
	$IIRMB,A,0.23,R,,HMB-3   ,,,,,001.20,184,,V,A*1F
	$IIRMC,030145,A,3730.078,N,12228.857,W,00.0,148,230514,15,E,A*1C
	$IIVHW,,,359,M,00.0,N,,*6B
	$IIVLW,08189,N,000.0,N*5B
	$IIVWR,152,R,05.1,N,,,,*63
	$IIGLL,3730.078,N,12228.857,W,030145,A,A*48
	$IIHDG,000,,,15,E*16
	$IIMTW,+14.5,C*38
	$IIMWV,150,R,05.0,N,A*12
	$IIMWV,152,T,05.1,N,A*17
	$IIRMC,030145,A,3730.078,N,12228.857,W,00.0,148,230514,15,E,A*1C
From there, it's all downhill, data can be analyzed...

For real...

The wind...

All set, Raspberry PI B, USB Hub, and a breadboard.
The connectors plugged on the breadboard are I2C ones.
I used it with a BMP180 (Air temperature & Pressure).
As of April 2014, here is what it takes:
| A Slice of PI | $ 9.05 | from Amazon |
| A 50K potentiometer | $ 0.95 | from Adafruit |
| An MCP3008 | $ 3.75 | from Adafruit |
| 2 connector terminals | 5 for $ 2.95 | from Adafruit |
| Resistors, wires, etc | ||
| Total | $ 16.70 |
Fritzing schema available here.